
Michał STYŁA, Dominik GNAŚ, Przemysław ADAMKIEWICZ
Information Technology Research & Development Centre (CBRTI sp. z o. o.), Rzeszów
WSEI University, Lublin
Introduction
The project consisted of using electromagnetic waves in the 5.8 GHz range and radio tomography technology to detect occupants indoors using reflective methods. Activities included the creation of a concept for the hardware layer, the structure and hierarchy of the data transfer network, as well as a method for processing the acquired waveforms into usable information. The acquired data (in the form of samples of the reflected signal) were transferred to a location engine located on the test server and then converted into location information of the users. Methods for the possible amplitude and frequency analysis of signals for human factor detection, the structure of the PCB and microwave antenna, and methods for the efficient management of data samples in order to make a system close to RTLS (Real Time Location System) speed served as the basic issues to be solved.
Design of the device
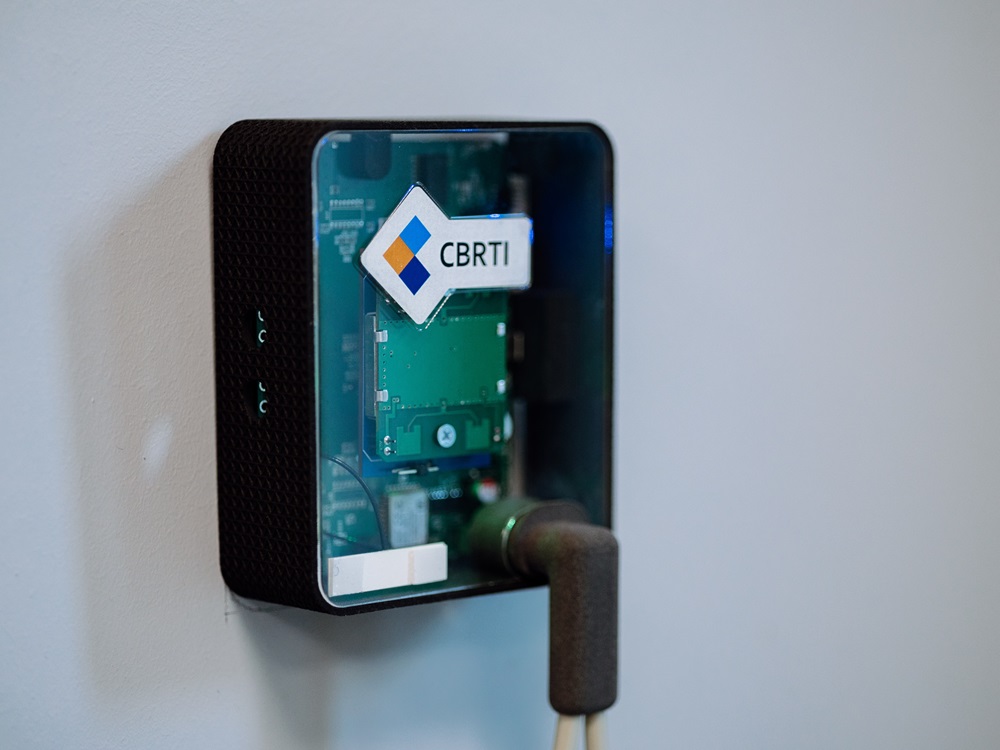
The focal point of the device is the MAX2828ETN+ transceiver, which is a front-end system, i.e. without an internal control unit in the form of a microcontroller, but controlled externally by means of registers and the bit/flag values contained therein. The transmit and receive paths are separated from each other and independently controlled. The master control functions are provided by a WSoC nRF52832 microcontroller. It performs the additional function of transporting readings from environmental sensors via Bluetooth 5. The rest of the components used are complex HF filtering and conditioning circuits, as well as integrated reference signal sources for timing or synthesis of other signals. The carrier frequency signal can be derived and fed into the circuit is via a quad-patch microwave antenna, which is attached to the PCB via an SMA connector or by a ‘sandwich’ method with the help of spacers via special transceiver line terminations. The final device parameters settled on a laminate with a size of 106 x 80 x 1.6 mm, radiated power of 10 mW and an effective range of 10 metres.The final appearance of the device is shown in Figure 1.
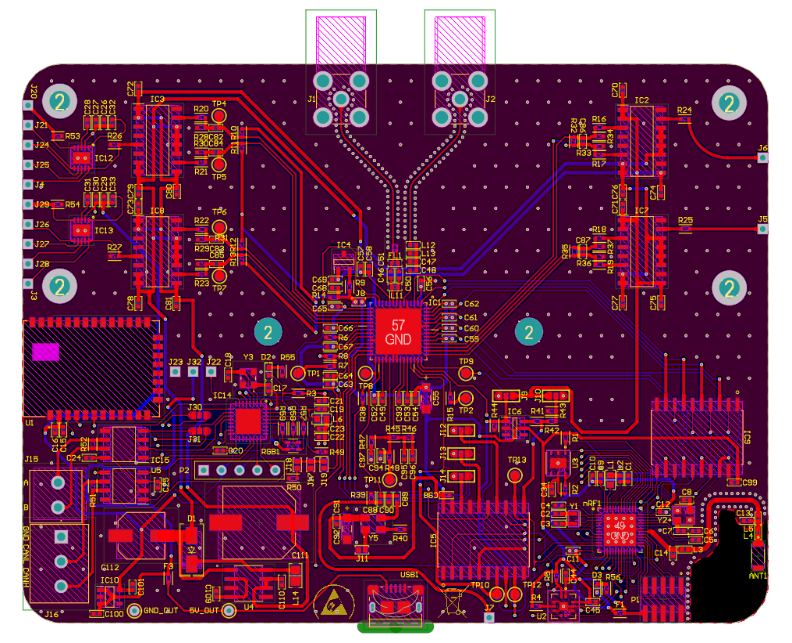
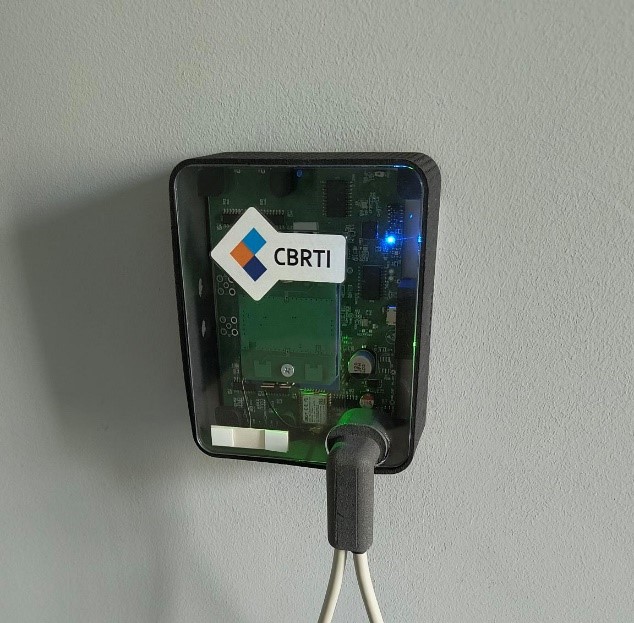
Fig. 1 1. Radio reflection probe prototype: (a) – patchwork of electrical connections, (b) – genuine specimen.
Signal processing and results
The user’s position information was determined from a transmitter network of 16 reflection probes in a room-bound arrangement, which is characteristic of tomography. Waves reflected from objects returning to the detector were amplified and filtered, and then passed to a circuit that reduced their frequency so that they could be successfully sampled by the ADC (Analog to Digital Converter). A CAN (Controller Area Network) bus and an access gateway with access to the building’s local network were responsible for transporting the data to the location engine located on the computing server. Each packet containing a signal sample was equipped with probe number information, as well as a time stamp to maintain synchronisation/consistency of the data sets. Example visualisations obtained from the amplitude and frequency analysis of the signals are presented in Figure 2. One starting point for the signal processing was to relate the amplitude to the distance from the detector/presence at the detector, and the other was to the use of the Doppler phenomenon for object movement. Extreme unfavourable cases of movement parallel to the detector were counterbalanced by readings from other probes where the movement shown was more unambiguous. The disappearance of motion below a certain threshold caused the last known position of the object to be remembered and resumed when the oscillograms fluctuated again. The maximum response from the reflection probes was induced within the radiation pattern of their microwave antennas, i.e. 45 degrees horizontally and 30 degrees vertically, resulting in a final accuracy of 40 to 50 cm, depending on the prevailing conditions.
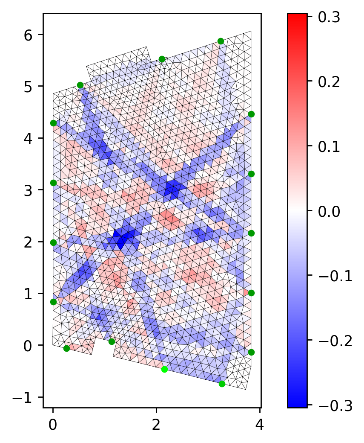
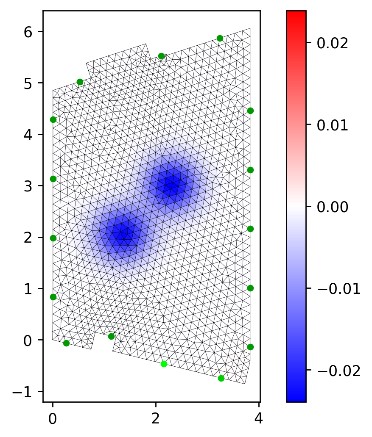
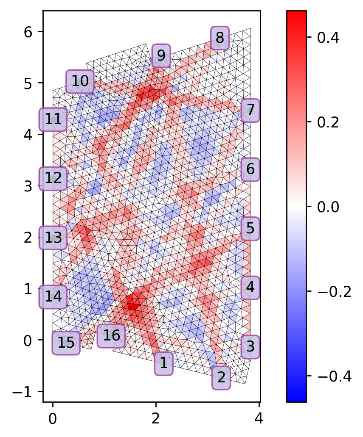
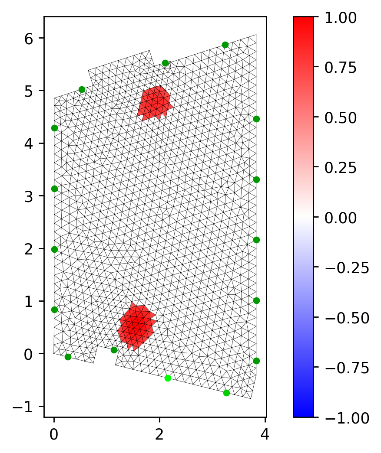
Fig. 2 2. Visualisation of users positions based on amplitude and frequency analysis of waveforms (relative units): (a) – TSVD direct result (static scenario b) – direct TSVD result with Gaussian filtration (static scenario I), (c) – TSVD direct result (static scenario II), (d) – direct TSVD result with Mexican Hat filtration (static scenario II).
Bibliography
- Brodeski D., Bilik I., Giryes R.: Deep Radar Detector, 2019 IEEE Radar Conference (RadarConf), 22–26 April 2019.
- Wnuk M., Chudy Z.: Pomiar mocy impulsu elektromagnetycznego mikrofal, Przegląd Elektrotechniczny, vol. 90, no. 8, pp. 239–242, 2014.
- Bilik I., Bialer O., Villeval S., Sharifi H., Kona K., Pan M., Persechini D., Musni M., Geary K.: Automotive MIMO radar for urban environments, 2016 IEEE Radar Conference (RadarConf),02–06 May 2016
- Zhang C., Luo W., Urtasun R.: Efficient Convolutions for Real Time Semantic Segmentation of 3D Point Clouds, In Proc. International Conference on 3D Vision (3DV), 2018.
- Styła M., Kiczek B., Kłosowski G., Rymarczyk T., Adamkiewicz P., Wójcik D., Cieplak T.: Machine Learning-Enhanced Radio Tomographic Device for Energy Optimization in Smart Buildings, Energies, vol. 16, no. 1, p. 275, 2022.